Resources Hub
- Home
- Resources Hub
- Accessing Student Data
- Accessing Module Level Statistics in Panopto
Accessing Module Level Statistics in Panopto
This helpsheet will guide you through accessing module level analytics in Panopto, in order to better understand how students are engaging with the overall video provision in your course.
Information Available in Panopto Statistics
By accessing the statistics area of Panopto, you can better understand how students are engaging with your video content. At a module level, this insight will cover the number of views on all your video content, how many of those views were unique by individual users, and data regarding the duration of viewer engagement.
Navigating to Module Level Statistics
To view module level statistics which Panopto calls folder level:
- Begin by logging into Blackboard and selecting your desired module from the My Site 2020 area.
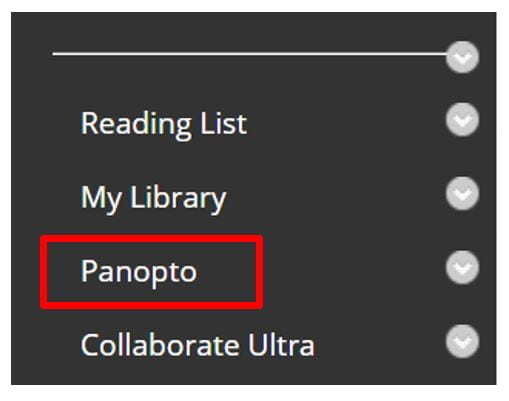
- Select the Panopto Tool Link.
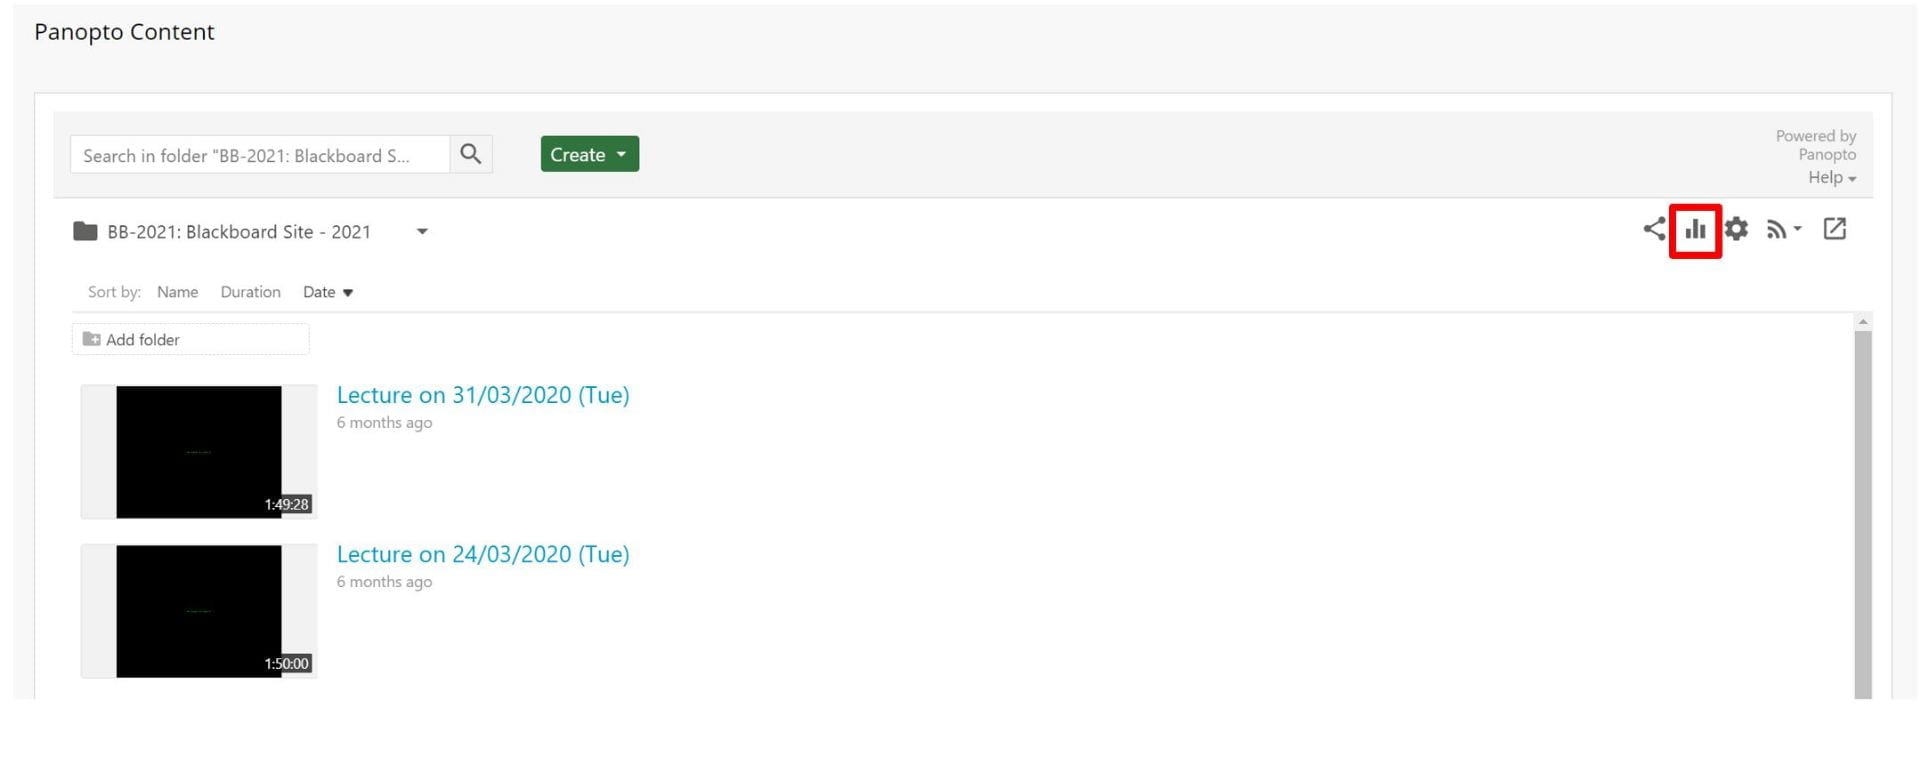
- Click the ‘Stats’ chart icon in the upper-right of the screen.
Viewing Module Level Statistics
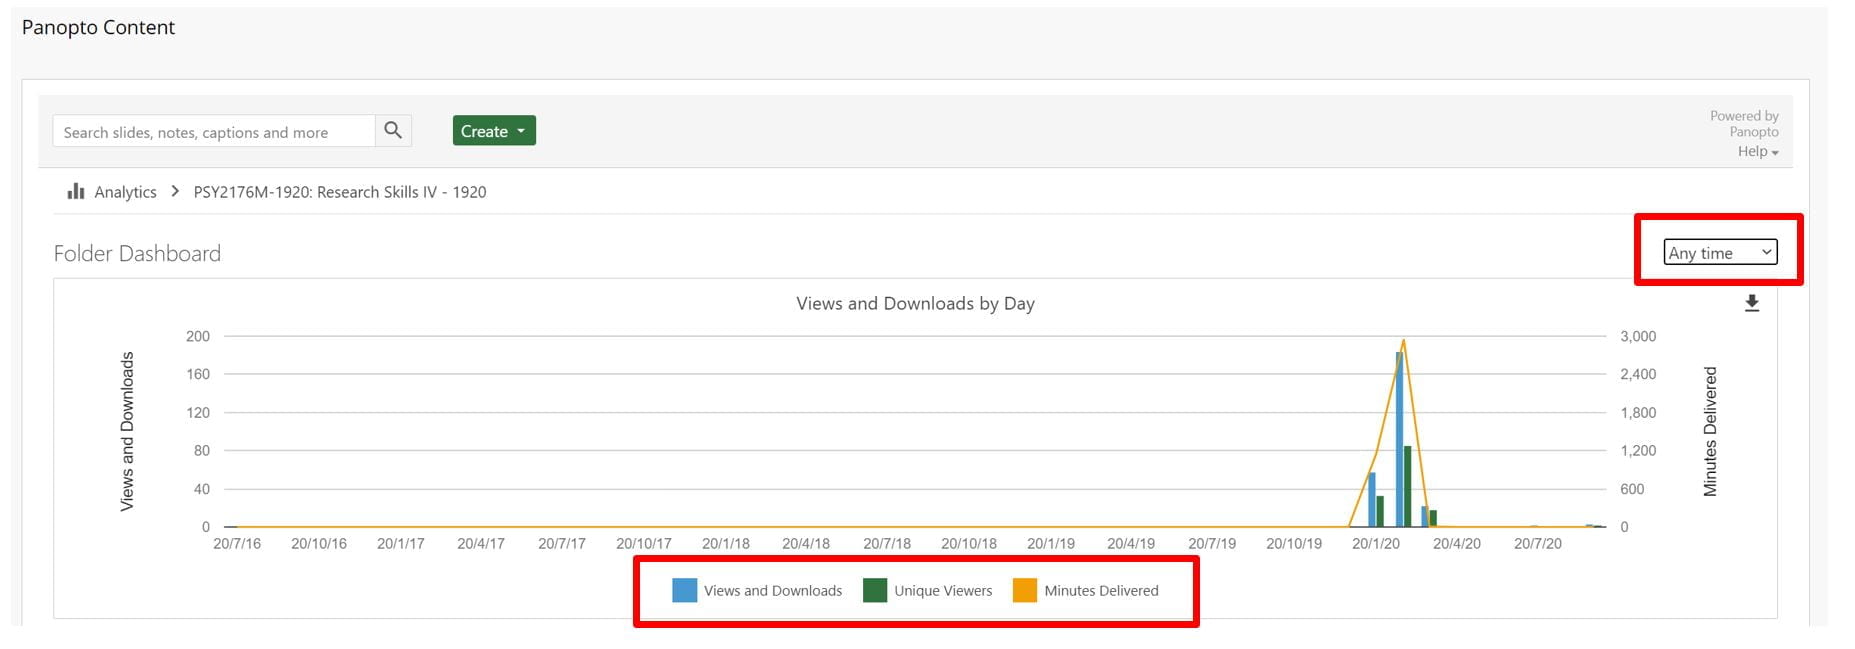
You will be shown by default a summary of engagement over the last 30 days, this can be changed by opening the drop-down menu, and selecting from the options including ‘Anytime’ or a Custom range, where you can pick a start and end date as appropriate.
The charts provided will display three key information types: views, unique viewers and minutes delivered.
- Views is the total number of times a video has been engaged with by all users.
- Unique viewers refers to the number of independent users who have watched the content.
- Minutes delivered accounts for the total minutes of the video that were streamed or downloaded.
Panopto use the term ‘delivered’ as it cannot guarantee the viewer was watching attentively.
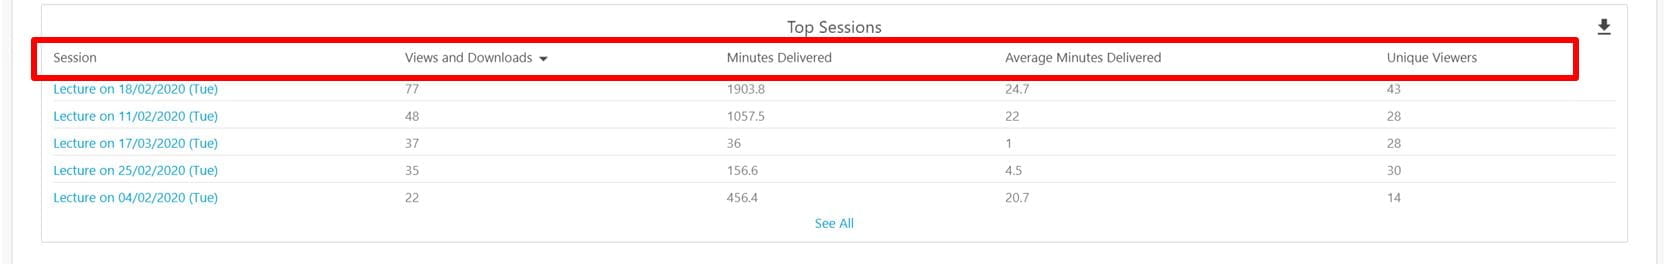
You will also see a table labelled ‘Top Sessions’. These statistics list your most popular lectures, micro-lectures or video material within the Panopto folder, which can be sorted by any of the following data: views and downloads, minutes delivered, average minutes delivered and unique viewers.
Clicking on the session title of a video listed will open statistics for that content individually.
Downloading Panopto Statistic Reports
You have the function to download a .csv file of your module level information, which you can open in a spreadsheet application like Microsoft Excel to further analyse the data. The ‘Views by Day’ export will show information for each view, whereas the ‘Top Viewers’ export will provide information for each viewer.