Resources Hub
- Home
- Resources Hub
- Poll Everywhere
- Generating reports within Poll Everywhere
Generating reports within Poll Everywhere
This helpsheet will explain how you can generate reports within Poll Everywhere, it will cover the two main types of report you might wish to generate; executive summaries and grade book reports.
Generating an executive summary report
Executive summaries are one kind of report you might wish to generate within Poll Everywhere. This report is particularly useful if you have created polls which have not been used with registered ‘participant’ student accounts. That is to say, all the responses will be anonymous but you will be able to see how many responses there were for each option and any correct or incorrect responses.
- Login to your Poll Everywhere account at polleverywhere.com
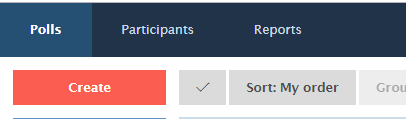
- Once you have logged in, click the ‘Reports’ button in the top navigation bar, above ‘Create’
- The Reports page will load and show you a list of your previously generated reports. You can click on any of these to download a copy of that report. To create a new report click ‘Create Report’.

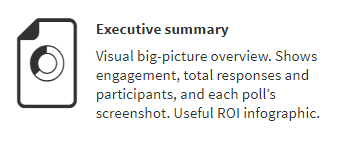
- Choose ‘Executive summary’ from the list of reports that appears.
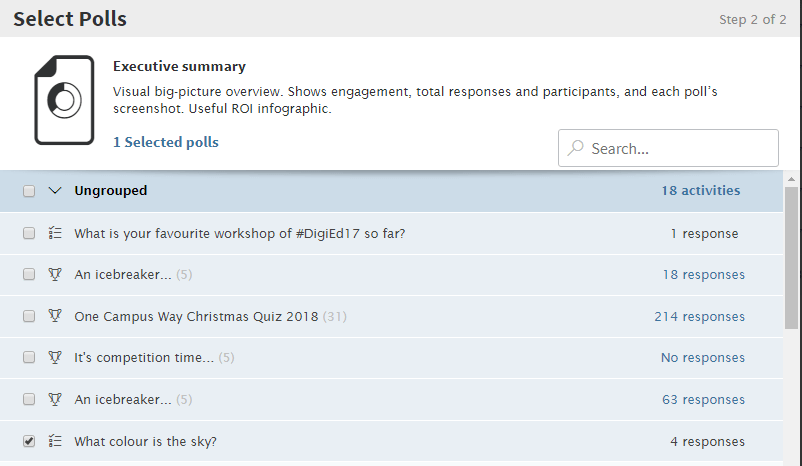
- You will now need to select the poll(s) you wish to generate this report for. Click the tick box next to any of the polls you wish to generate a report for. Note: This report will contain all polls that you select, so it is important to ensure they have a relevance to each other if you select multiple polls.
- Click ‘Finish’ to generate the report.

- Your report will be generated with a variety of information on the poll you selected. You will also see a graphic of the poll responses as they appeared in real time when you conducted the poll.

- You can see that the report has a lot of useful information for you to use including:
- The number of polls selected
- The number of participants that took part
- Audience size
- Average responses
- Average engagement
Each question will also show the engagement for that particular question, so you can easily work out if everyone answer or if there were certain users who did not reply or answer any one particular question.
- If you know how many students are normally in your teaching session, you can input this number and create a more accurate report. Click the ‘Participants’ tab in the right hand menu to open up the settings.

- In the audience size, you will see that it lists the number of people who responded in total to your poll (the audience). In our case this is 10. However, if we know we should have 30 students on our register, we can adjust this number so that the responses reflect the whole makeup of the class and take into account those students who did not participate.
You will see that the report automatically updates the audience number and the levels of engagement as show in the percentage wheels.
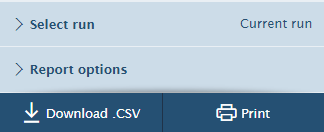
- To download or save your report, click ‘Download .CSV’ or ‘Print’. Print will let you save your work as PDF file if you use the print to PDF feature.
Creating a gradebook report
A gradebook report is a good way to see how your students are progressing across a module or programme of study if you are using Poll Everywhere regularly or to track student progress. Note: to generate a gradebook report, you will need to have been using Poll Everywhere with registered ‘Participant’ accounts. Please see helpsheet ‘PE_011 – Tracking student progress with ‘participant’ accounts’ for details of how to set these accounts up.
- Login to your Poll Everywhere account at polleverywhere.com
- Once you have logged in, click the ‘Reports’ button in the top navigation bar, above ‘Create’
- The Reports page will load and show you a list of your previously generated reports. You can click on any of these to download a copy of that report. To create a new report click ‘Create Report’.
- Click ‘Gradebook’ from the list of reports that appear.
- You will now need to select the poll(s) you wish to generate this report for. Click the tick box next to any of the polls you wish to generate a report for. Note: This report will contain all polls that you select, so it is important to ensure they have a relevance to each other if you select multiple polls.
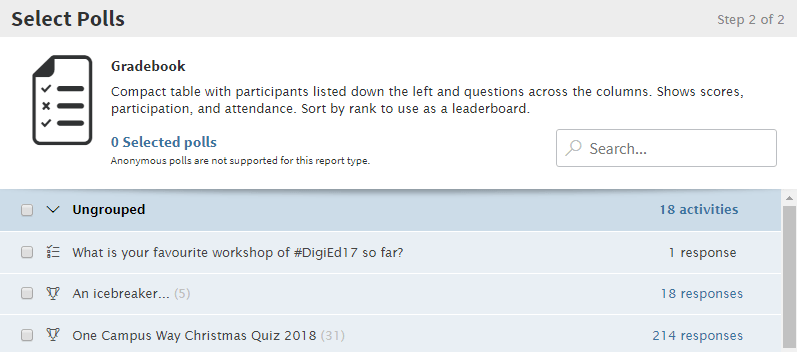
- Click ‘Finish’ to generate the report.
- A gradebook report will be generated and you will be able to see how each individual student responded to each poll question. If you chose a correct answer for any poll question, the students will be marked with a cross or a tick and this will allow a score to be generated.
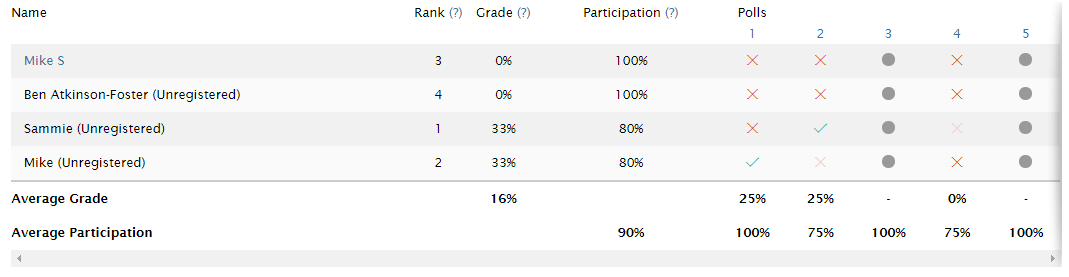
Note: As you can see, gradebook reports work best when two approaches are taken. Firstly that you use them with registered ‘participant’ accounts only, you will see on the above screenshot that some students show as ‘Unregistered’ which means they do not have a ‘participant’ account. In this case there is no way to ensure they will use the same details next time. Secondly, you should always try to ensure that you select a correct answer when you are setting up your poll questions. That way, you will be able to see if the student answered correctly and the report will generate an overall score. In this way, the gradebook report works best when you use Poll Everywhere to deliver an MCQ type test.
- You will notice that the students who are using their registered ‘participant’ accounts will be shown with their name as a hyperlink. Clicking on this hyperlink for any one student, will take you to their individual response history.
Note: This individual response history is not unique to the polls you have chosen to include in your report. The response history will show the students responses across all polls they have responded to while using their registered ‘participant’ account. For this reason it is important to ensure you clearly name your polls so that it is clear what question the student has answered.
- To download or save your report, click ‘Download .CSV’ or ‘Print’. Print will let you save your work as PDF file if you use the print to PDF feature.