Resources Hub
- Home
- Resources Hub
- Accessing Student Data
- Poll Everywhere Reports: Accessing Engagement Data
Poll Everywhere Reports: Accessing Engagement Data
This helpsheet will explain how you can generate reports within Poll Everywhere, it will predominately cover the two main types of report you might wish to generate; Executive Summaries and Gradebook Reports.
What reports are available to me in Poll Everywhere?
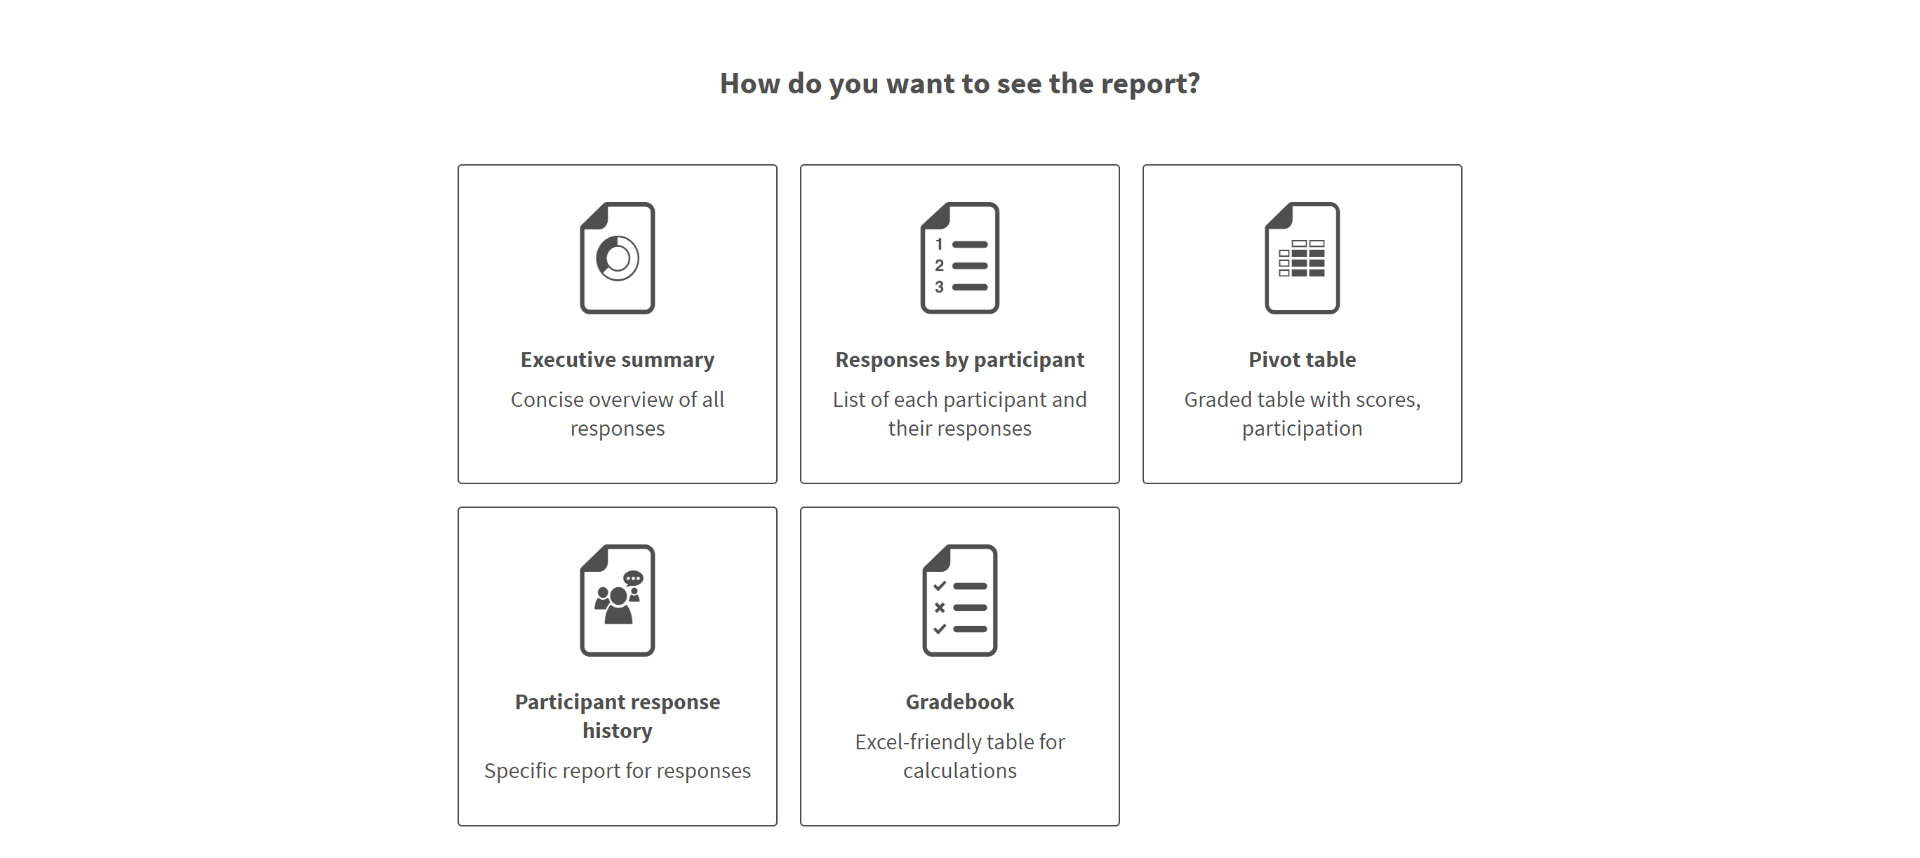
Whilst this helpsheet will cover the two main types of report, Executive Summary and Gradebook, there are a total of five reports that can be accessed, they are described as follows:
- Executive Summary – Visual big-picture overview. Shows engagement, total responses and participants, and each poll’s screenshot.
- Responses by Participant – One section per participant, one line per question. If a group of questions was used as a survey, use this report to view each participant’s responses in order.
- Pivot Table – Full detail table with one row per response, perfect for exporting to Excel pivot tables. Useful for grouping, crosstabs, or computing sums and averages.
- Participant Response History – One section per participant, one line per response. Shows when, and how, each individual response was submitted.
- Gradebook – Compact table with participants listed down the left and questions across the columns. Shows scores, participation, and attendance. Sort by rank to use as a leader board. Similar to the Grade Centre in Blackboard.
Accessing the Executive Summary Report
Executive summaries are one kind of report that you might wish to generate within Poll Everywhere. This report provides an overview of each poll you have created; it summarises the results in a separate table for each one, and displays the total responses, participants, and engagement.
This report is particularly useful if you have created polls which have not been used with registered ‘participant’ student accounts; whilst the responses may be anonymous, you will be able to see how many responses there were for each option and any correct or incorrect responses.
In order to access the Executive Summary Report, you need to complete the following:
- Login to your Poll Everywhere account at https://www.polleverywhere.com/.
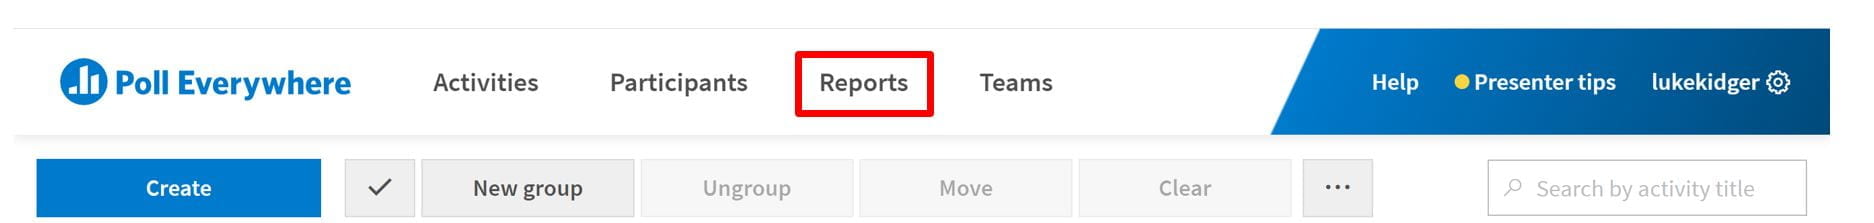
- Once you have logged in, click the ‘Reports’ button in the top navigation bar – depending on your screen resolution this may be displayed within a ‘More’ tab and a drop-down menu.
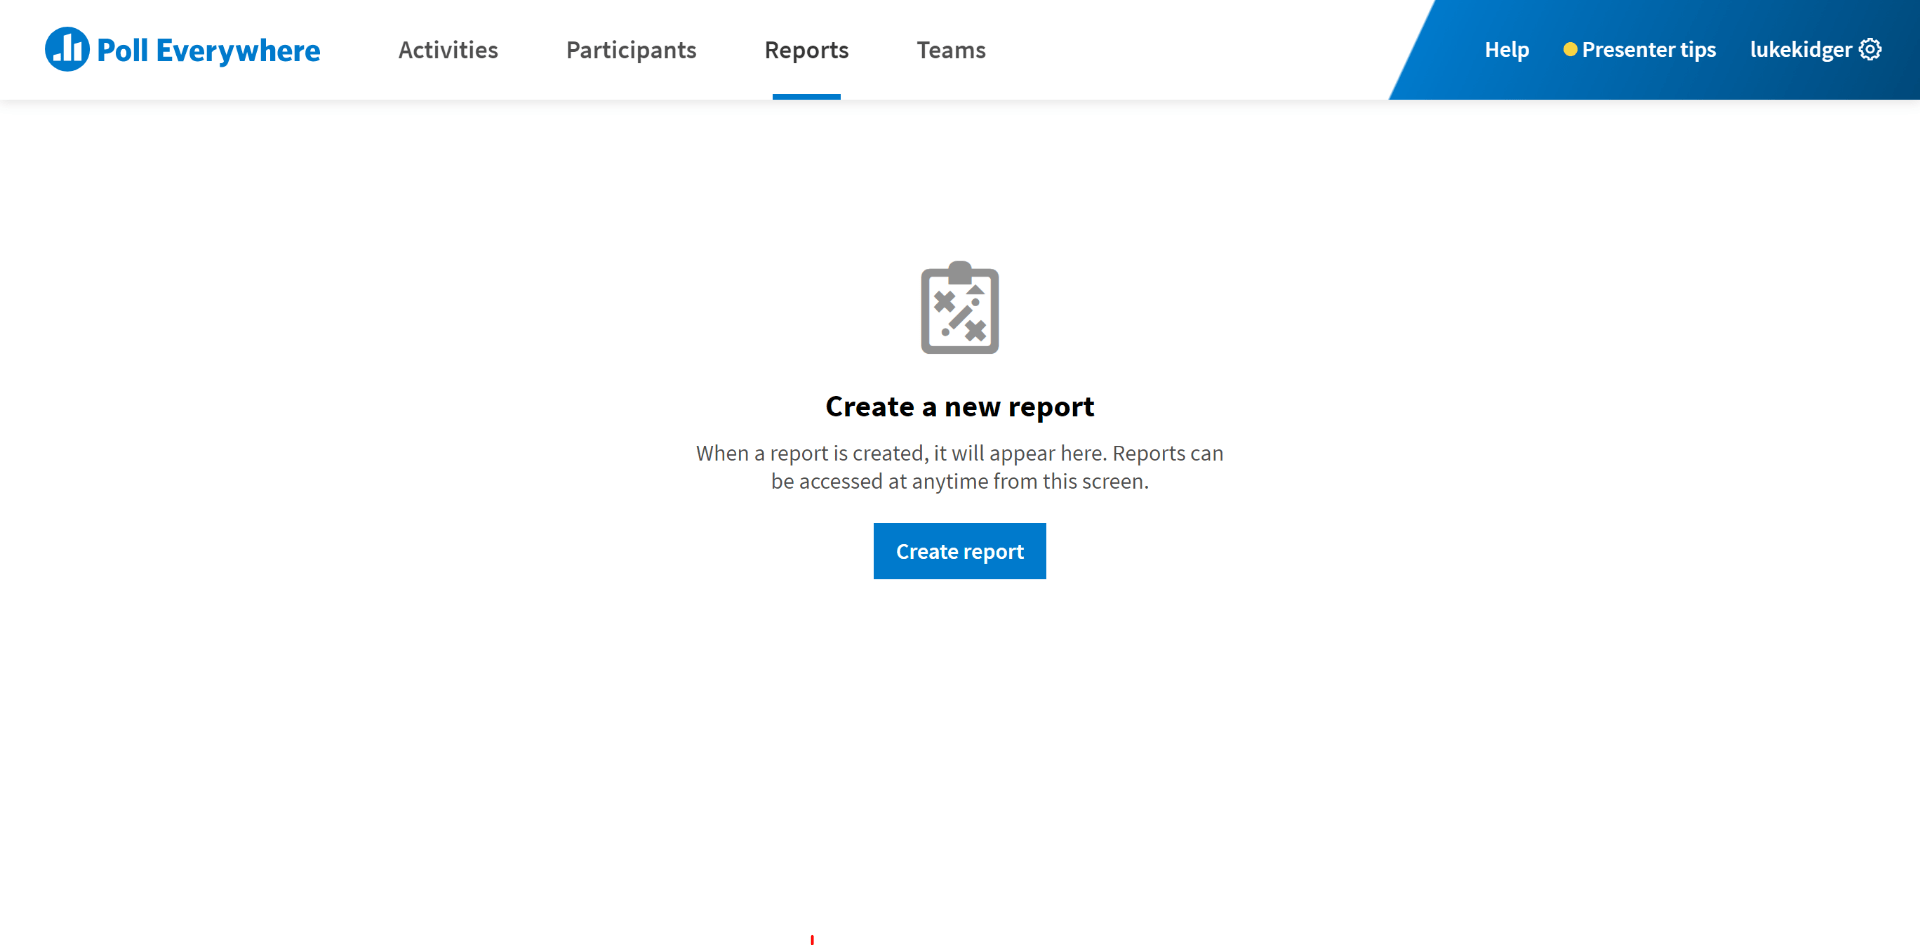
- The Reports page will load and display one of two screens:
- If this is the first time you have run any kind of Poll Everywhere report, you will have the option to create a new report.
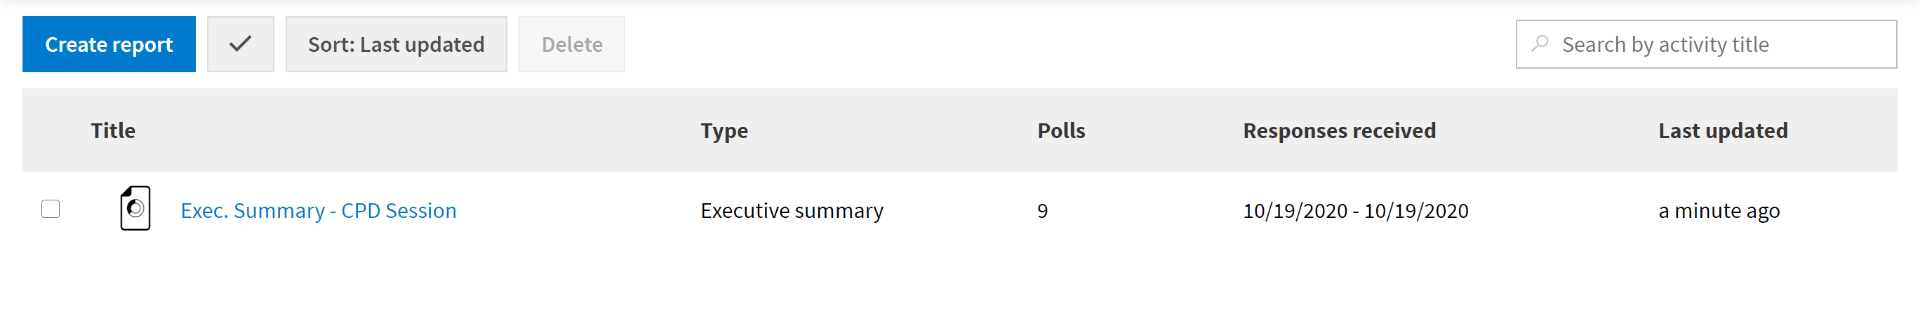
- If you have created reports before, you will see a list of those you have previously generated, along with the option to create a new report.
Once you have selected the report that you want to create, in this instance Executive Summary, you will need to complete the following:
- Select the poll(s) you wish to generate this report for by clicking the tick box to the left of the name of the relevant polls.
Note: This report will contain all polls that you select, so ensure they are relevant to each other.
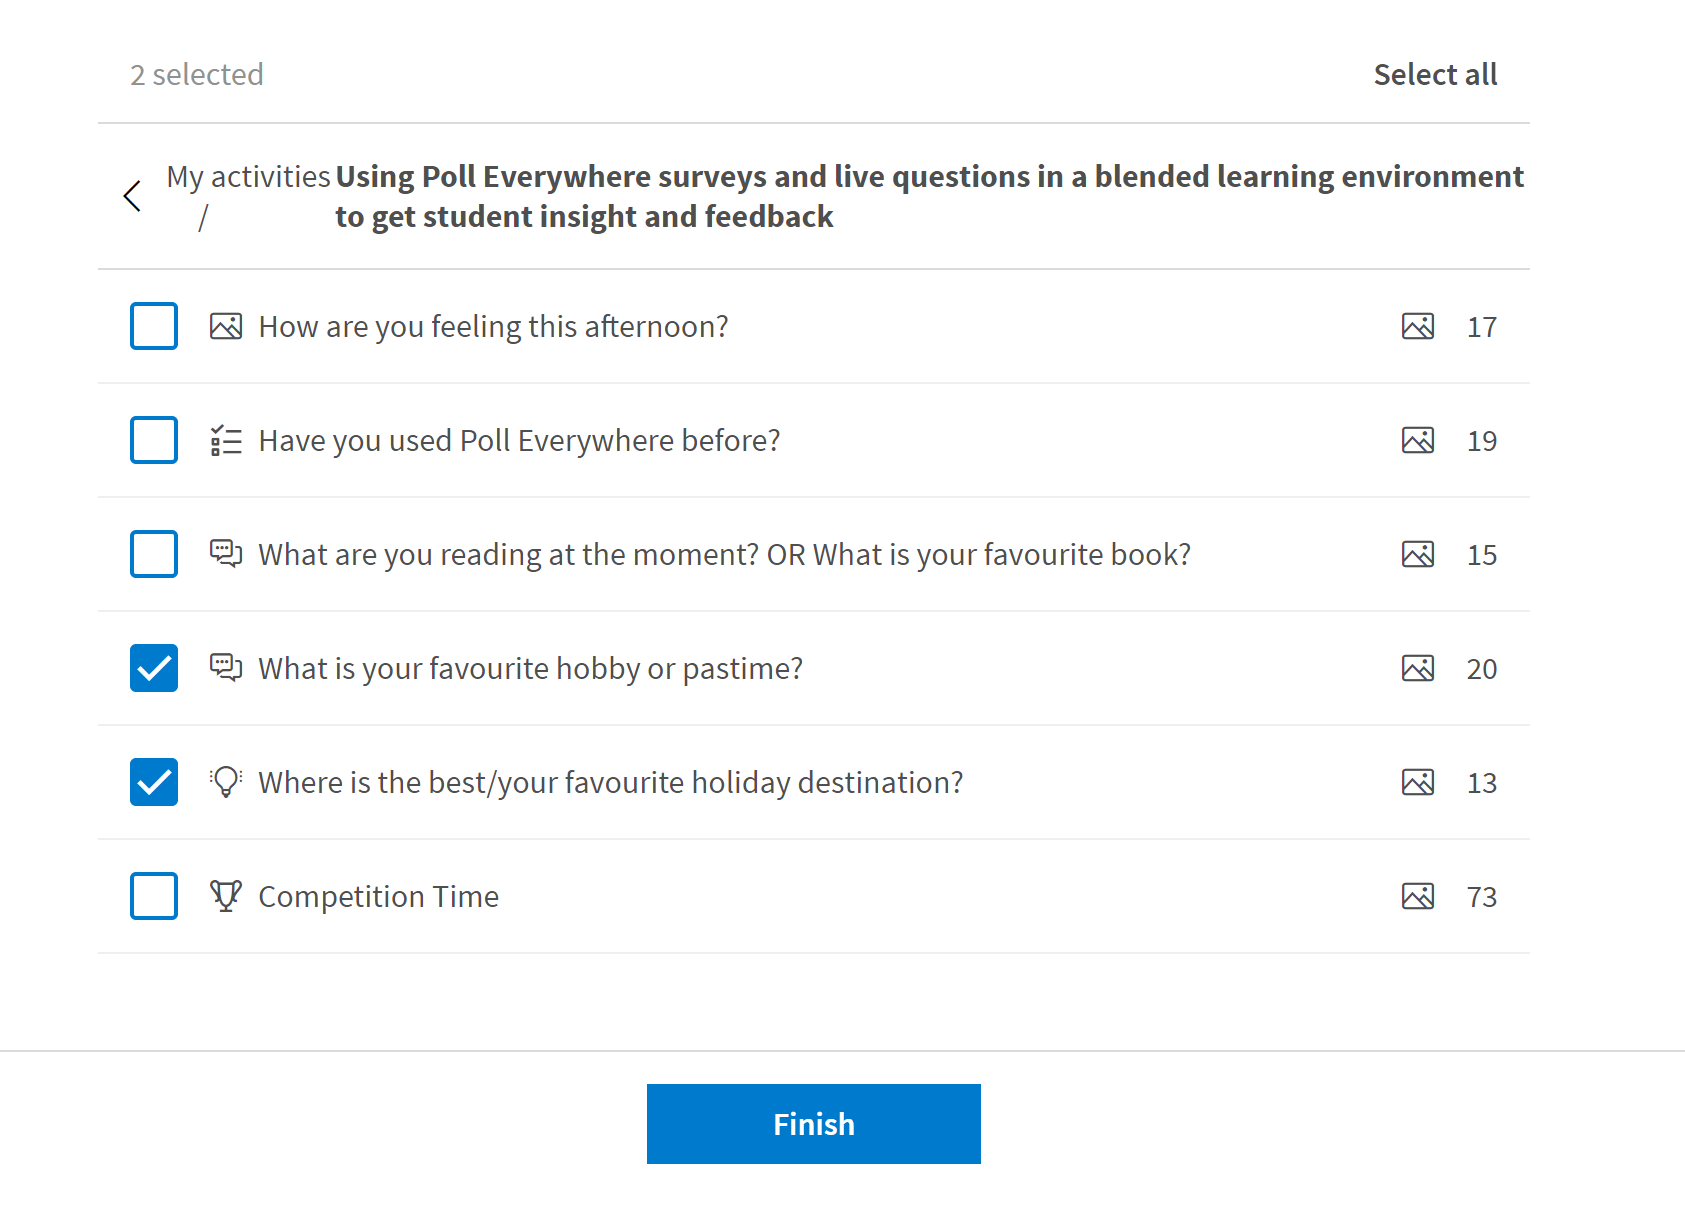
- Click ‘Finish’ to generate the report.
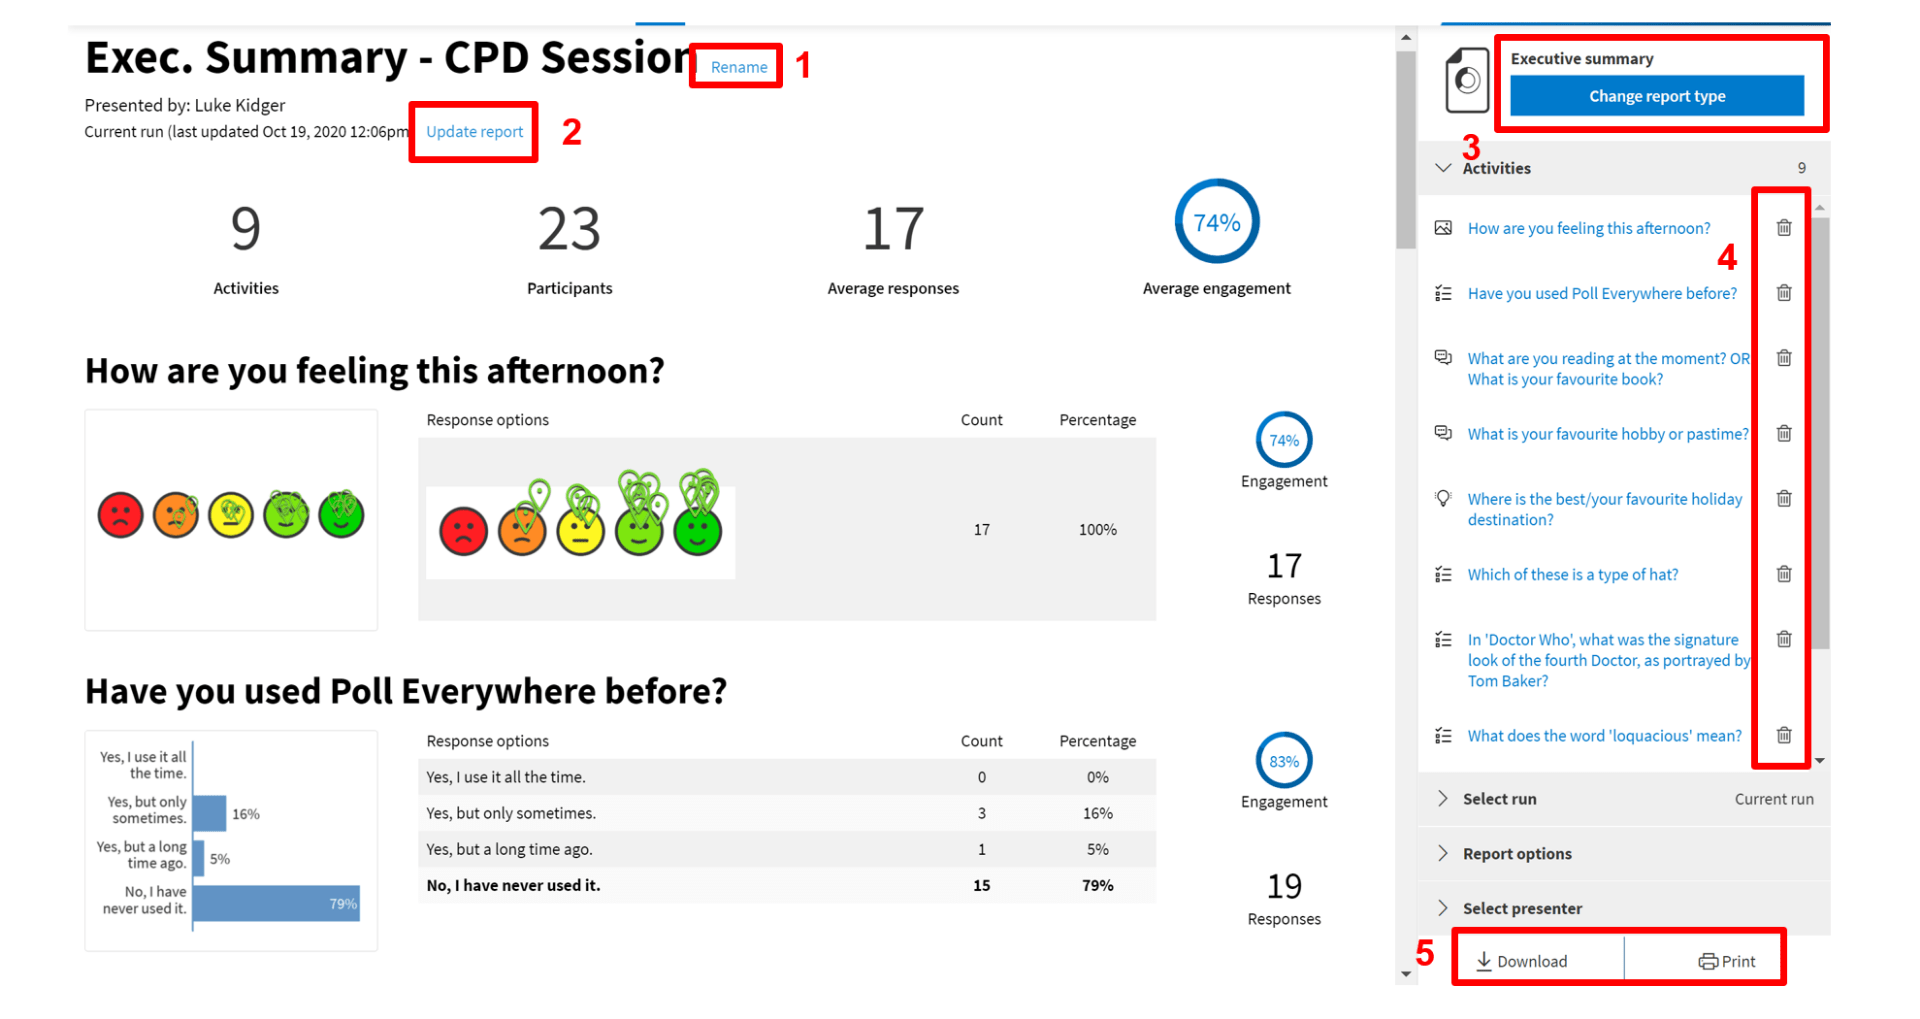
Your report will be generated with a variety of information on the poll(s) you selected. You will also see a graphic of the poll(s) responses as they appeared in real time when you conducted the poll(s). There are some key areas to note from the report once it has been generated, you can:
- Rename your report as required.
- Update the ‘run date’ to refresh the data.
- Change the report type.
- Remove polls from the report.
- Download and print the results.
The engagement percentages are calculated by dividing the total response number by the number of users who joined the session.
Note: Not all users who joined the session may have engaged with each Poll.
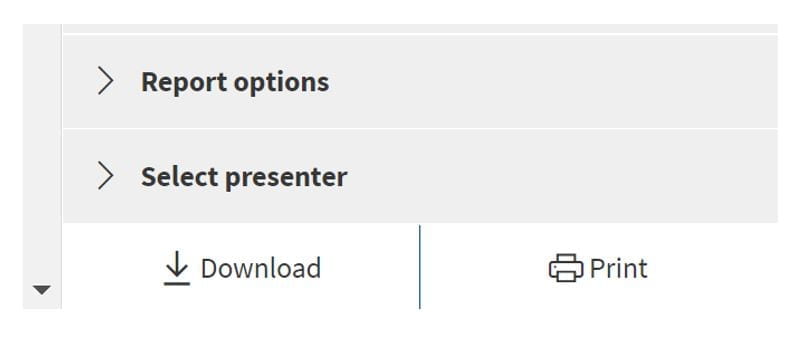
To download or save your report, click ‘Download .CSV’ or ‘Print’. Print will let you save your report as PDF file if you use the Print to PDF feature.
Accessing the Gradebook Report
The Gradebook Report is a good way to see how your students are progressing across a module or programme of study if you are using Poll Everywhere regularly to track student progress.
Note:To generate a gradebook report, you will need to have been using Poll Everywhere with registered ‘Participant’ accounts. Please see helpsheet ‘PE_011 – Tracking student progress with ‘participant’ accounts’ for details of how to set these accounts up.
To create a Gradebook Report, complete the following steps:
- Login to your Poll Everywhere account at https://www.polleverywhere.com/.
- Once you have logged in, click the ‘Reports’ button in the top navigation bar – depending on your screen resolution this may be displayed with a ‘More’ tab and a drop-down menu.
- The Reports page will load and display one of two screens:
- If this is the first time you have run any kind of Poll Everywhere report, you will have the option to create a new report.
- If you have created reports before, you will see a list of those you have previously generated, along with the option to create a new report.
Once you have selected the report that you want to create, in this instance the Gradebook Report, you will need to complete the following:
- Click ‘Gradebook’ from the list of reports that appear.
- You will now need to select the polls you wish to generate this report for. Click the tick box next to any of the polls you wish to generate a report for.
Note: This report will contain all polls that you select, so it is important to ensure they have a relevance to each other.
- Click ‘Finish’ to generate the report.
Interpreting a Gradebook Report
A gradebook report will be generated, and you will be able to see how each individual student responded to every poll question. If you chose a correct answer for any poll question, the students will be marked with a cross or a tick dependant on if they answered correctly. This will allow a score to be generated.
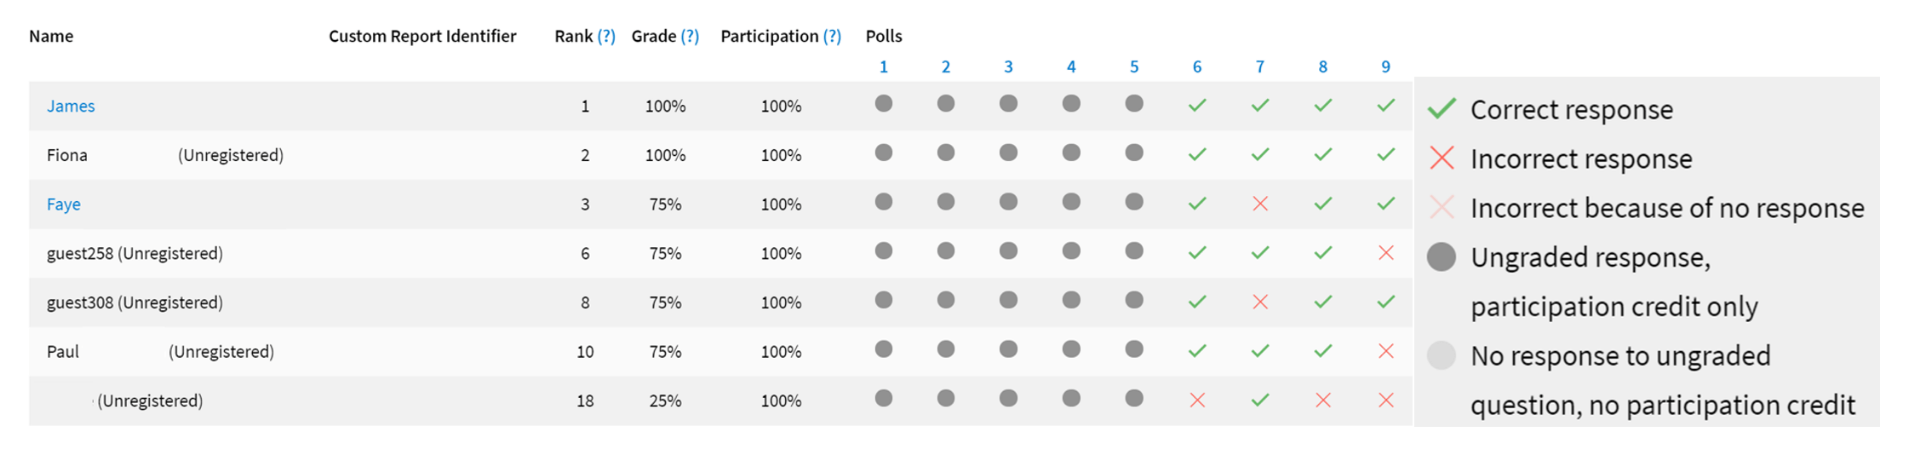
As you can see from the screenshot above, the Gradebook Reports uses a range of symbols to indicate what kind of response the student gave; whether it was a correct, incorrect, ungraded or no response.
You may also find when using the Gradebook Reports that the best approach is to use registered ‘participant’ accounts. If you don’t, there is no way to guarantee that every time a user joins, they will enter the same name. This will make progress tracking difficult – as shown above.
If you plan to use Poll Everywhere for regular assessment and require the ability to carefully track students’ scores over time as an assessment method, contact your Digital Education Developer or the dt@lincoln.ac.uk for more information.
Secondly, you should always try to ensure that you select a correct answer when you are setting up your poll questions with a view to using the Gradebook report. That way, you will be able to see if the student answered correctly and the report will generate an overall score.
Note: Students who are using their registered ‘participant’ accounts will be shown with their name as a hyperlink. Clicking on this hyperlink for any one student, will take you to their individual response history. This individual response history is not unique to the polls you have chosen to include in your report.
The response history will show the students responses across all polls they have responded to while using their registered ‘participant’ account. For this reason it is important to ensure you clearly name your polls so that it is obvious which question the student has answered.
To download or save your report, click ‘Download .CSV’ or ‘Print’. Print will let you save your report as PDF file if you use the Print to PDF feature.