Resources Hub
- Home
- Resources Hub
- Accessing Student Data
- Talis Elevate Analytics: Glimpse View
Talis Elevate Analytics: Glimpse View
This helpsheet explains the difference between Talis Elevate’s Glimpse View, one of the three types of analytic viewpoints available to instructors as well as the steps required to access it.
Talis Elevate’s Types of Analytics
Talis Elevate offers three types of analytics to consider:
- Glimpse: Based on a specific resource.
- Explore: Found within the Elevate Manager.
- Analyse: Accessing the RAW Event data.
Accessing Elevate Glimpse from Blackboard
The Talis Elevate Content Tool is integrated within Blackboard, which means that you can access resource and module analytics by navigating to your resources directly. Navigate to your module content, click the link to open your resource in the Elevate viewer.
The Glimpse Level view is designed to allow for easy and effective comprehension of how individual students are engaging with your content.
To see the analytics for a resource, click the statistics button in the player:
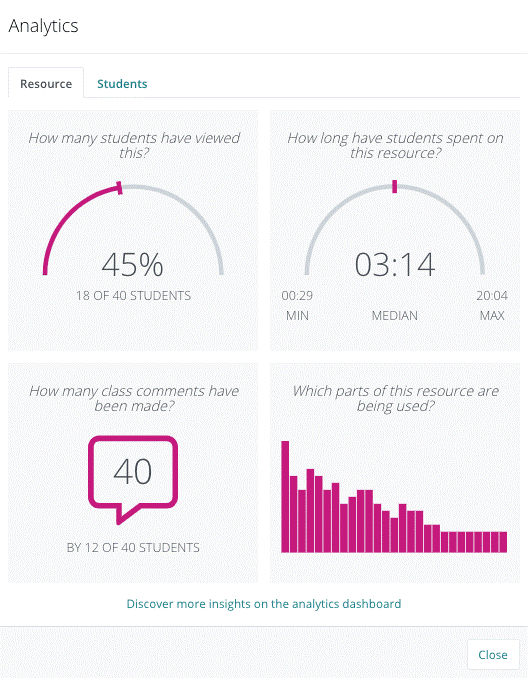
Upon clicking this chart icon, a pop-up window will display summary of the views and engagements for this specific resource. The information is caregorised by four tiles:
- How many students have viewed this resource – a visual representation of how many students have viewed the resource in comparison those that have not.
- How long have students spent on this resource – showing the range of time spent engaging with the resource, displaying figures for the minimum, median and maximum time.
- How many class comments have been made – shows the total number of comments on the resource, as well as the number of students that made comments compared to those who have been allocated the resource.
- Which parts of this resource are being used – a bar chart shows the breakdown of engagements throughout the resource. This chart is interactive; you can click on a single bar to see details on where within the resource this bar is referencing. In this example, we can see the resource is well engaged with at the beginning, but has a lower student engagement towards the end.
Understanding the Student Activity Tab
In your Glimpse Analytics View there is a second tab labelled ‘Students’, by entering this area you can see the length of time each student has spent accessing the resource. It is important to note that this is based on the ACTIVE engagement from the student during their session, meaning that this figure is distinguished from simply having the resource open.
Below is an example of the ‘Students’ tab. Students are ordered from the most engaged to least engaged, based on their total engagement time. The list of students is presented in three rankings, those in the upper quartile, median and lower quartile, which helps to easily identify students that might need further guidance or intervention to ensure proper engagement with the resources.
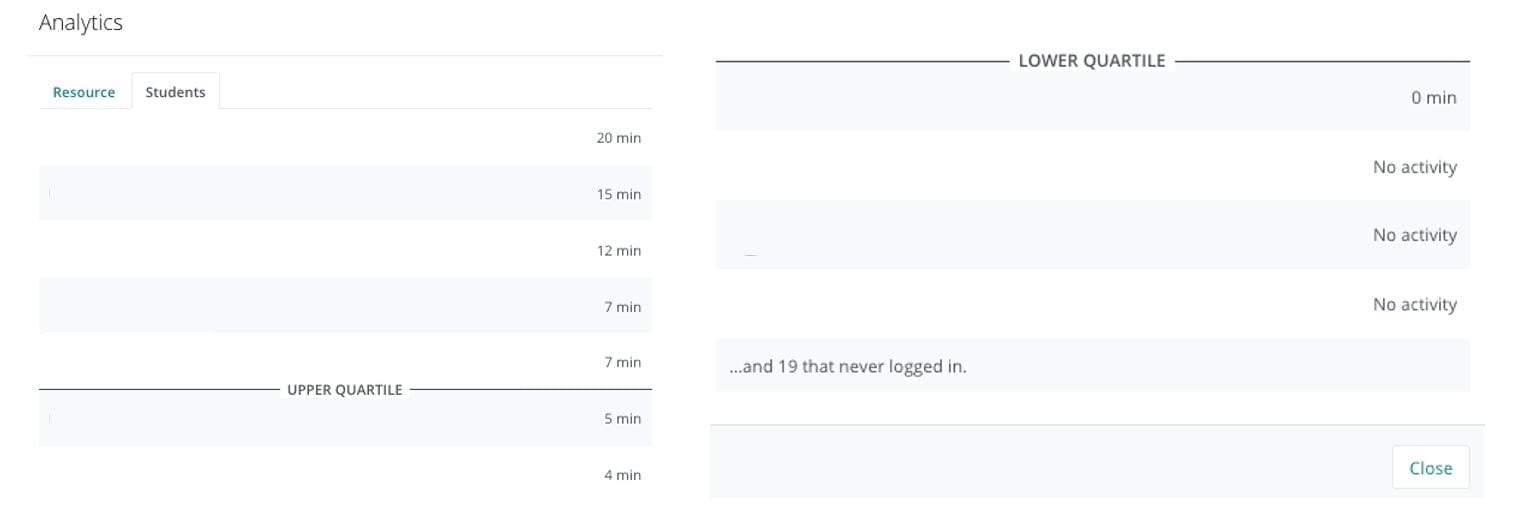
In this example, we have three types of students in the Lower Quartile. Those with 0 minutes have logged in and scarcely engaged with the resource, those with No Activity have logged in but not yet opened the content, and those who have never logged in are in their own tab.
Are my Students Actively Engaging?
Talis Elevate analyses the kind of engagement made by a user to define if the engagement is valid or not, this decides whether to pause or continue the ‘timer’. For example, the timer is stopped:
- If a student is inactive on a resource for a sustained period of time.
- If a user has the active tab on another webpage.
- If a user is skimming through pages.
To understand what activity Talis Elevate does record, the system will log when a student is:
- Highlighting elements of text.
- Using the toolbar navigation tools (e.g. search).
- Writing a personal note.
- Writing a class comment.
This data is also used in the ‘Explore’ Analytics view as mentioned at the beginning of this guide, we will detail how you can use this analytics area in the next support resource.