Resources Hub
- Home
- Resources Hub
- Accessing Student Data
- Blackboard Activity Data: Site Reports
Blackboard Activity Data: Site Reports
This helpsheet explain the steps required to export a range of Blackboard data using the Site Reports tool, and detail how this information can help to understand user activity within specific areas of your module site.
Customising Site Reports
Whilst every site report has a default setting, there are options to customise what is produced prior to exporting the data. Depending on the report, options to customise the information may include filtering the date range, selecting which students and users to include, and the ability to define the average range and target performance.
Locating the Site Reports?
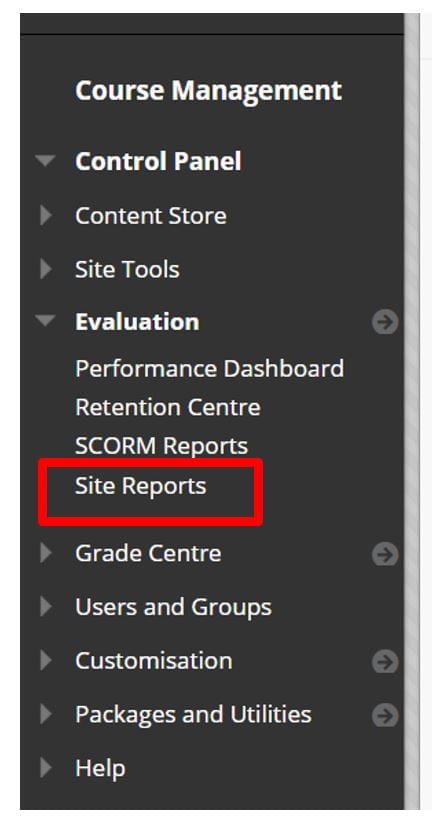
Open your module site in Blackboard and expand the ‘Evaluation’ tab, here you will find a list of tools available for understanding student activity, click ‘Site Reports’.
What Reports are Available?
The list of reports available to site instructors are as follows:
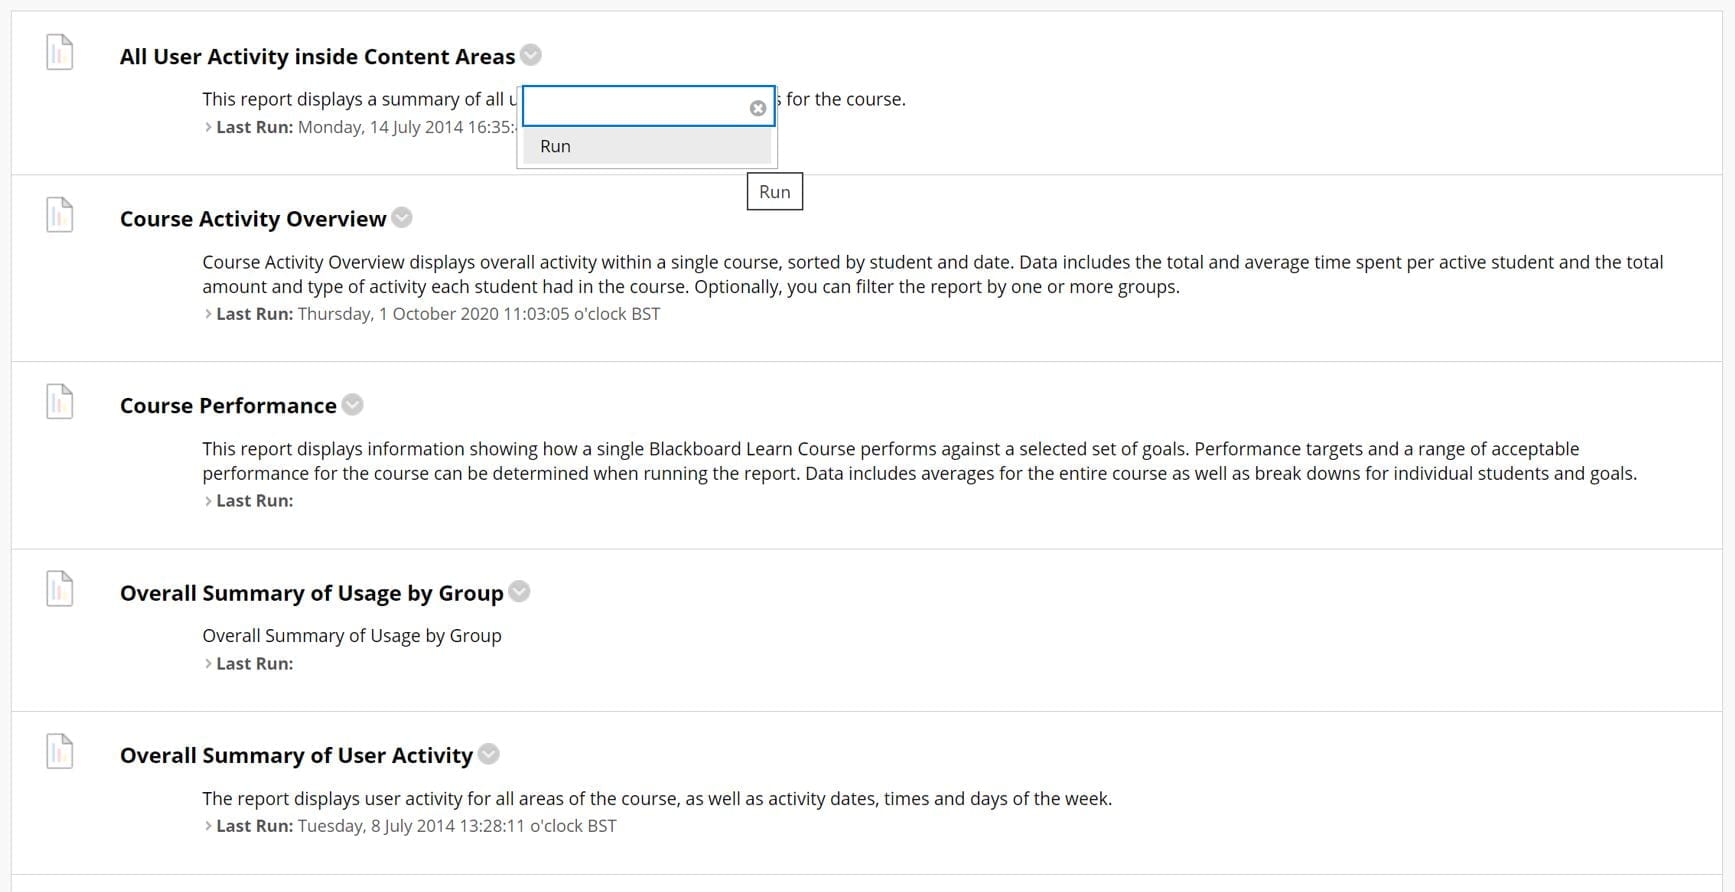
- All User Activity inside Content Areas – summarises all user activity inside content areas for a site. This determines which students are active in your course and which content areas they use.
- Site Activity Overview – displays activity within a single site, sorted by student and date. Data includes the total and average time spent per student and the total amount and type of activity each student had in the course.
- Site Coverage Report – displays data on site items that have been aligned to goals.
- Site Performance – displays how a single site performs against a selected set of goals.
- Overall Summary of User Activity – displays user activity for all areas of your site, as well as activity dates, times, and days of the week. Use this report to view student access as well as how often course tools are used.
- Single Site User Participation Report – displays the number of user submissions in your course for assignments, tests, discussions, blogs, and journals within the chosen time frame.
- Student Overview for Single Course – displays an individual student’s activity within your site, sorted by date. Data includes the total overall time a student spent in your course.
- User Activity in Forums – displays a summary of user activity in discussion forums in your site.
- User Activity in Groups – displays a summary of user activity in groups for your site.
How to Generate a Site Report
Begin by navigating to your Blackboard site, scrolling down to Site Management, and entering the Site Reports menu found with the Evaluation tab. To generate a report:
- Click the chevron arrow for the report you have chosen and select Run.
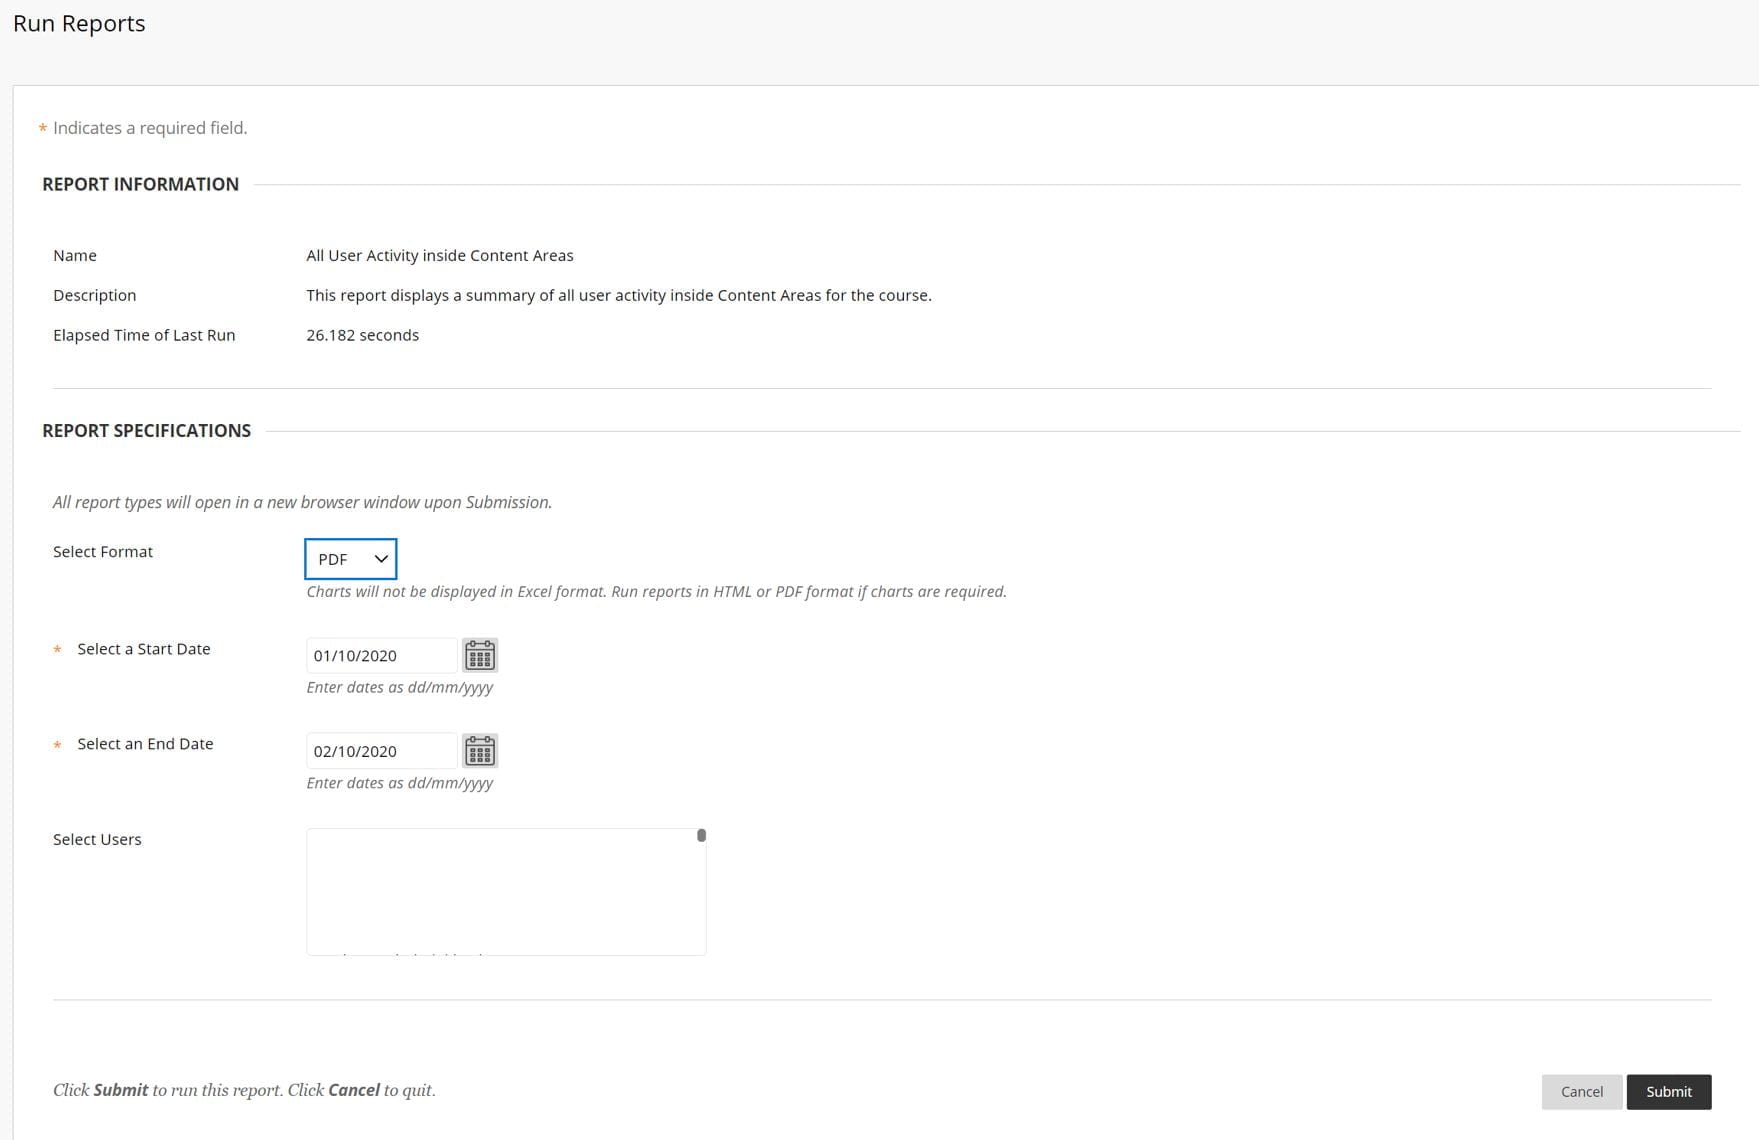
The report will process in the background and redirect you to the Run Report page.
- Select the file format from the drop-down menu that you would like your data to be exported in, for most reports you can choose from PDF, HTML, Excel, or Word.
- Decide on the start and end date range for your report.
- Finally, select which users you would like to see data about, you can select all quickly by pressing Ctrl+A on a Windows device or Cmd+A on a Mac, or select individual student by holding the Ctrl/Cmd key respectively and clicking consecutively on the user’s names.
- Click submit and wait for the report to finish downloading. PDF and HTML formats open in a new window, whereas Excel and Word documents will prompt you to save the file to your area first.